Stamen Design researcher and Oakland resident Michal Migurski has to hand it to WikiLeaks. The leakers gave their data on Afghanistan to the best artists in the world at publications like the UK Guardian, and the dynamic map of the countryside erupting over eighteen months into a fiery chickenpox of IED attacks sent a message this summer that nightly news couldn’t.
Migurksi thinks about such things because he is behind Oakland’s widely used online crime-watch tool Oakland Crimespotting by Stamen Design. The nine-person company recently received a $400,000 Knight News Challenge grant to get the tools of Crimespotting into as many cities as possible. And their latest project, dubbed “prettymaps” and launched this August, has similarly huge ambitions.
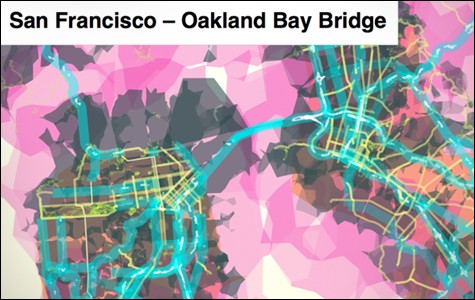

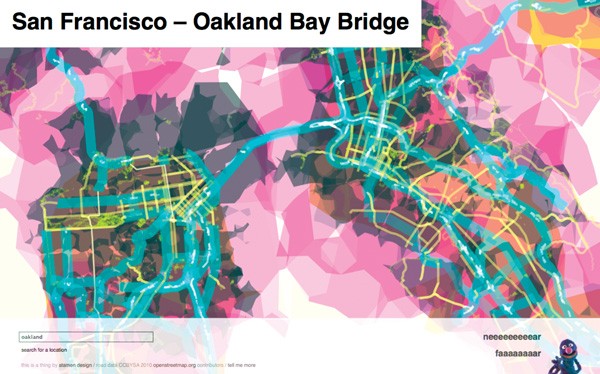
A view of the Bay Area on prettymaps.
Point your browser at Prettymaps.Stamen.com and it’ll probably start to groan. Prettymaps is Google Maps on acid and steroids, a bandwidth-gobbling mashup of four huge data sets. Though it works in Firefox, it’s meant for more powerful web browsers that don’t yet exist.
Zoom in from a global view and the Bay Area resembles an abstract impressionist dream of gooey pink pastel cells circuited by purple-blue freeway networks. Prettymaps mainly combines location information from photo-sharing site Flickr, the Washington Post‘s high-grade topography map called Natural Earth, and a new wiki of street maps called OpenStreetMap.
At its heart, the global prettymap illustrates the digital divide between the Bay Area — pulsing with all types of info — and Africa, a literal tabula rasa of tech. Migurski said Stamen Design’s goal for prettymaps is to show other people that this information exists, and empower them with tools to use it.
That goal echoes Stamen Design’s most successful East Bay project, Oakland Crimespotting, an essential, elegant tool for potential renters, home buyers, realtors, or anyone else interested in street crime. The site has grown over three years into a slick, responsive, timely, and accurate snapshot of crime reports in Oakland.
The idea came from Migurski living in West Oakland in 2007, where he grew frustrated with the city’s clunky online crime map. After the assassination of Oakland reporter Chauncey Bailey, Migurski’s personal project became a Stamen Design challenge. It was so successful that, after its launch, the City of Oakland stopped sharing its data.
Prodded by activists, the city turned the data stream back on and improved it. Since then, Stamen Design has revamped the look of the tool, added police beats for citizens to contact the proper officers, and added a “pie of time” that shows what crimes were committed, say, during the night, or during the morning commute.
The $400,000 Knight award Stamen Design won in June will go to two years of research and development on how to spread the tools of Oakland Crimespotting to any community that wants it. “The technology around sticking dots on maps is pretty well-established for a lot of folks, but there’s always this question of ‘Where do you get the maps?’ and ‘Where do you get the data, where do you get the shapes, where does all this stuff come from, and where does it go?'” Migurski said. “We’re trying to create as many on-ramps and off-ramps to this kind of mapping technique as possible.”
From Facebook to Yelp to Flickr to FourSquare, location services are red-hot in tech right now, and that’s adding to the deluge of data that defines modern life. Maps are one way to help hack through that thicket, says Migurski, and empowering people to be able to visualize has real, life-saving effects.
Social workers use OpenStreetMap to graph the slums of Kibera, Nairobi, and quake-ravaged Port-au-Prince faster than any cartographer could, so aid workers know where to send help. “This is important for places where you don’t have the department of public works essentially telling you what is and isn’t a street,” Migurski said.
Back home, Migurski uses OpenStreetMap inside Crimespotting to quickly update changes to one-way streets near Lake Merritt due to construction on 14th Street. “I ripped out all the streets they had demolished and fixed all the one-ways and two-ways. It took me five or ten minutes to fix that entire construction area.”
Slick, artistic data visualization makes people want more public information, too. “All this information out there that’s published by governments, companies, communities, and police — all these groups put out hundreds and hundreds of thousands of thousands of spreadsheets, really,” said Migurski. “It’s hard to get a handle on what you’re actually looking at. The technologies of visualizing and mapping make it possible for people to gain some literacy around that and reasoned discussions around it.
“When you make these things, government becomes more open, because their citizens gain some literacy and expectations that they’re going to be shown this stuff.”
There is one thing missing from Oakland Crimespotting to this day, Migurski notes. BART police refuse to cough up their daily crime reports to Crimespotting, he said. But that’s a whole other data point to discuss.